



SPACE WEATHER : FORECAST
LINK TO REAL TIME DATA
This page details predicted space weather conditions based on current solar wind data.
Subscribe to our SPACALRT email list to receive real-time space weather disturbance warnings.
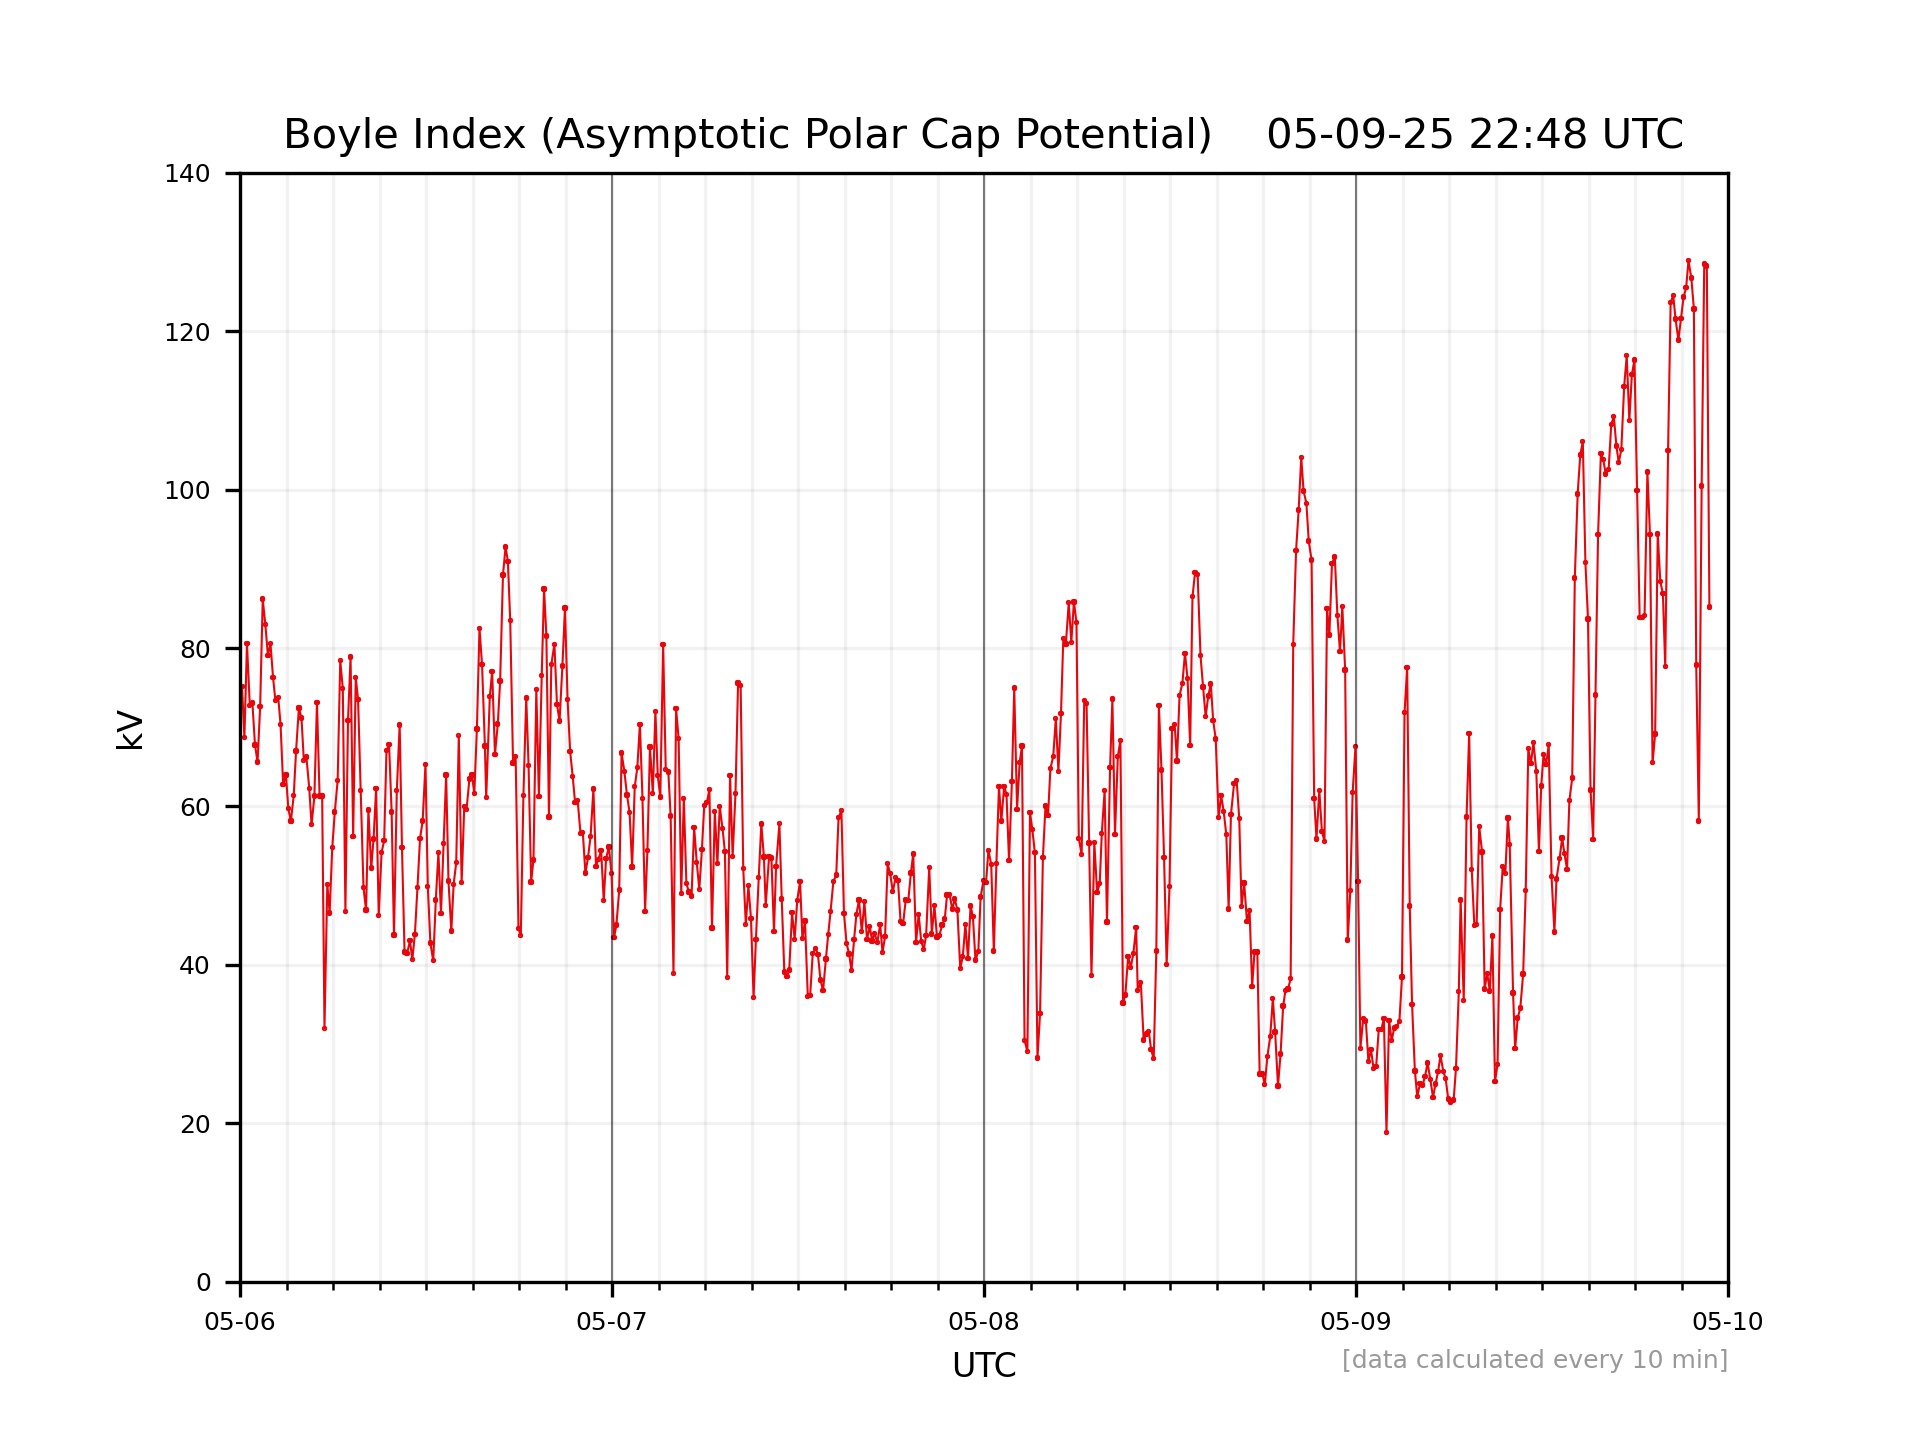
Boyle Index (Asymptotic Polar Cap Potential)
The Boyle Index (BI)

where v is the solar wind velocity in km/sec and B is the magnitude of the IMF, is a good predictor of the Polar Cap Potential drop for times when the solar wind is steady and the index is 160 kV or less. For the rare events where the Boyle index exceeds 160 kV, the actual cross-polar cap potential generally saturates, only exceeding 200 kV in rare occasions, thus in those cases the Boyle Index is an overestimate of the Polar Cap Potential. A Boyle index of 200 averaged over three hours will often yield a Kp index of 6 or higher; for 250 or more, the Kp index is often 7 or higher.
Predicted Geomagnetic Activity Indices (Kp, Dst and AE Proxies)
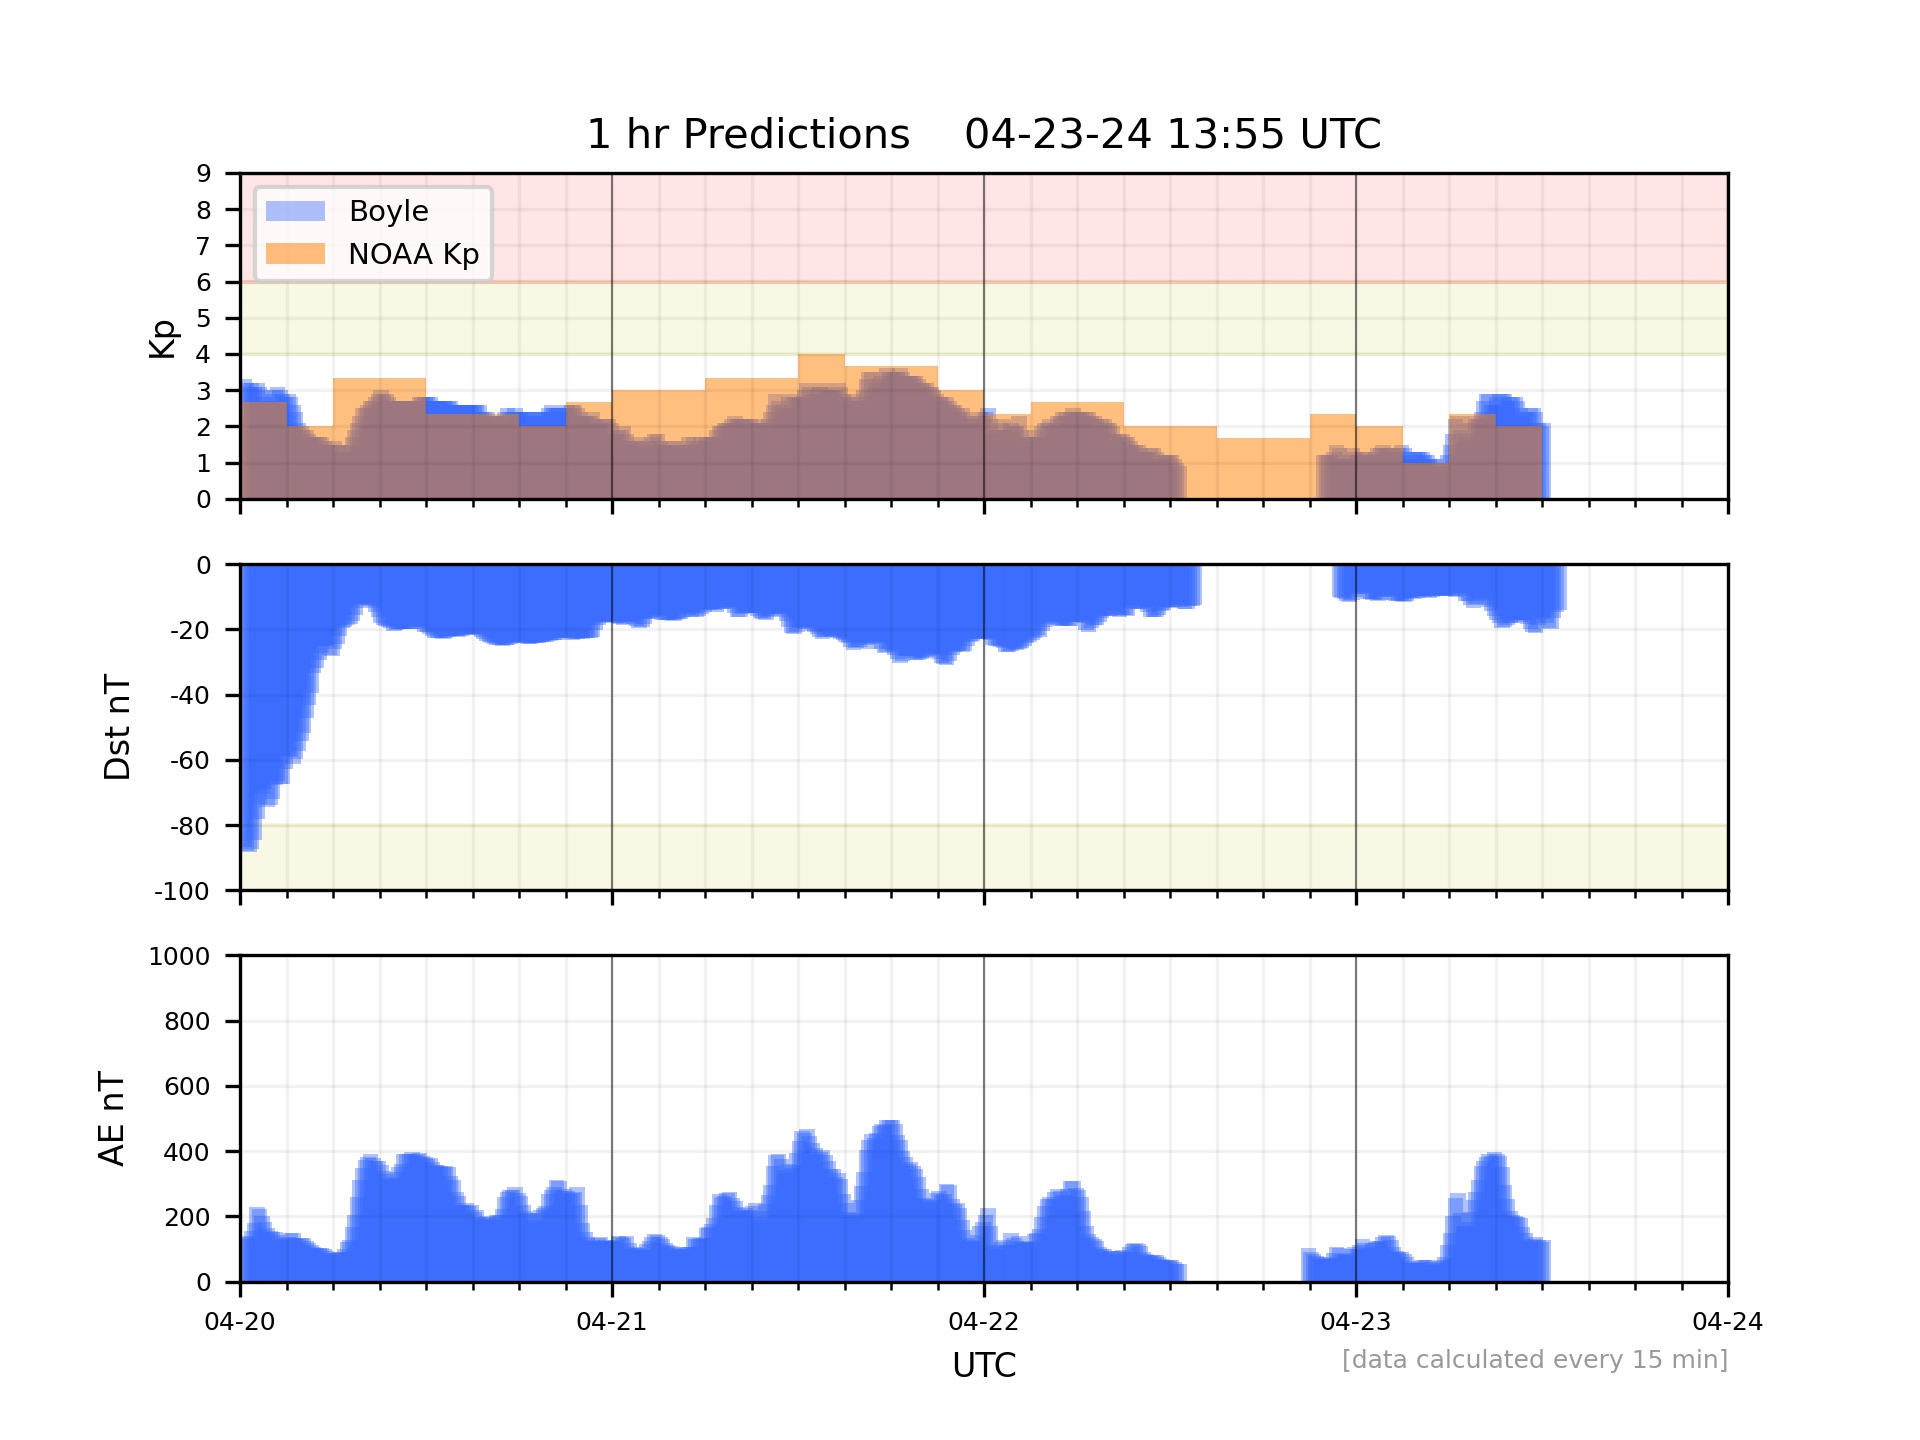
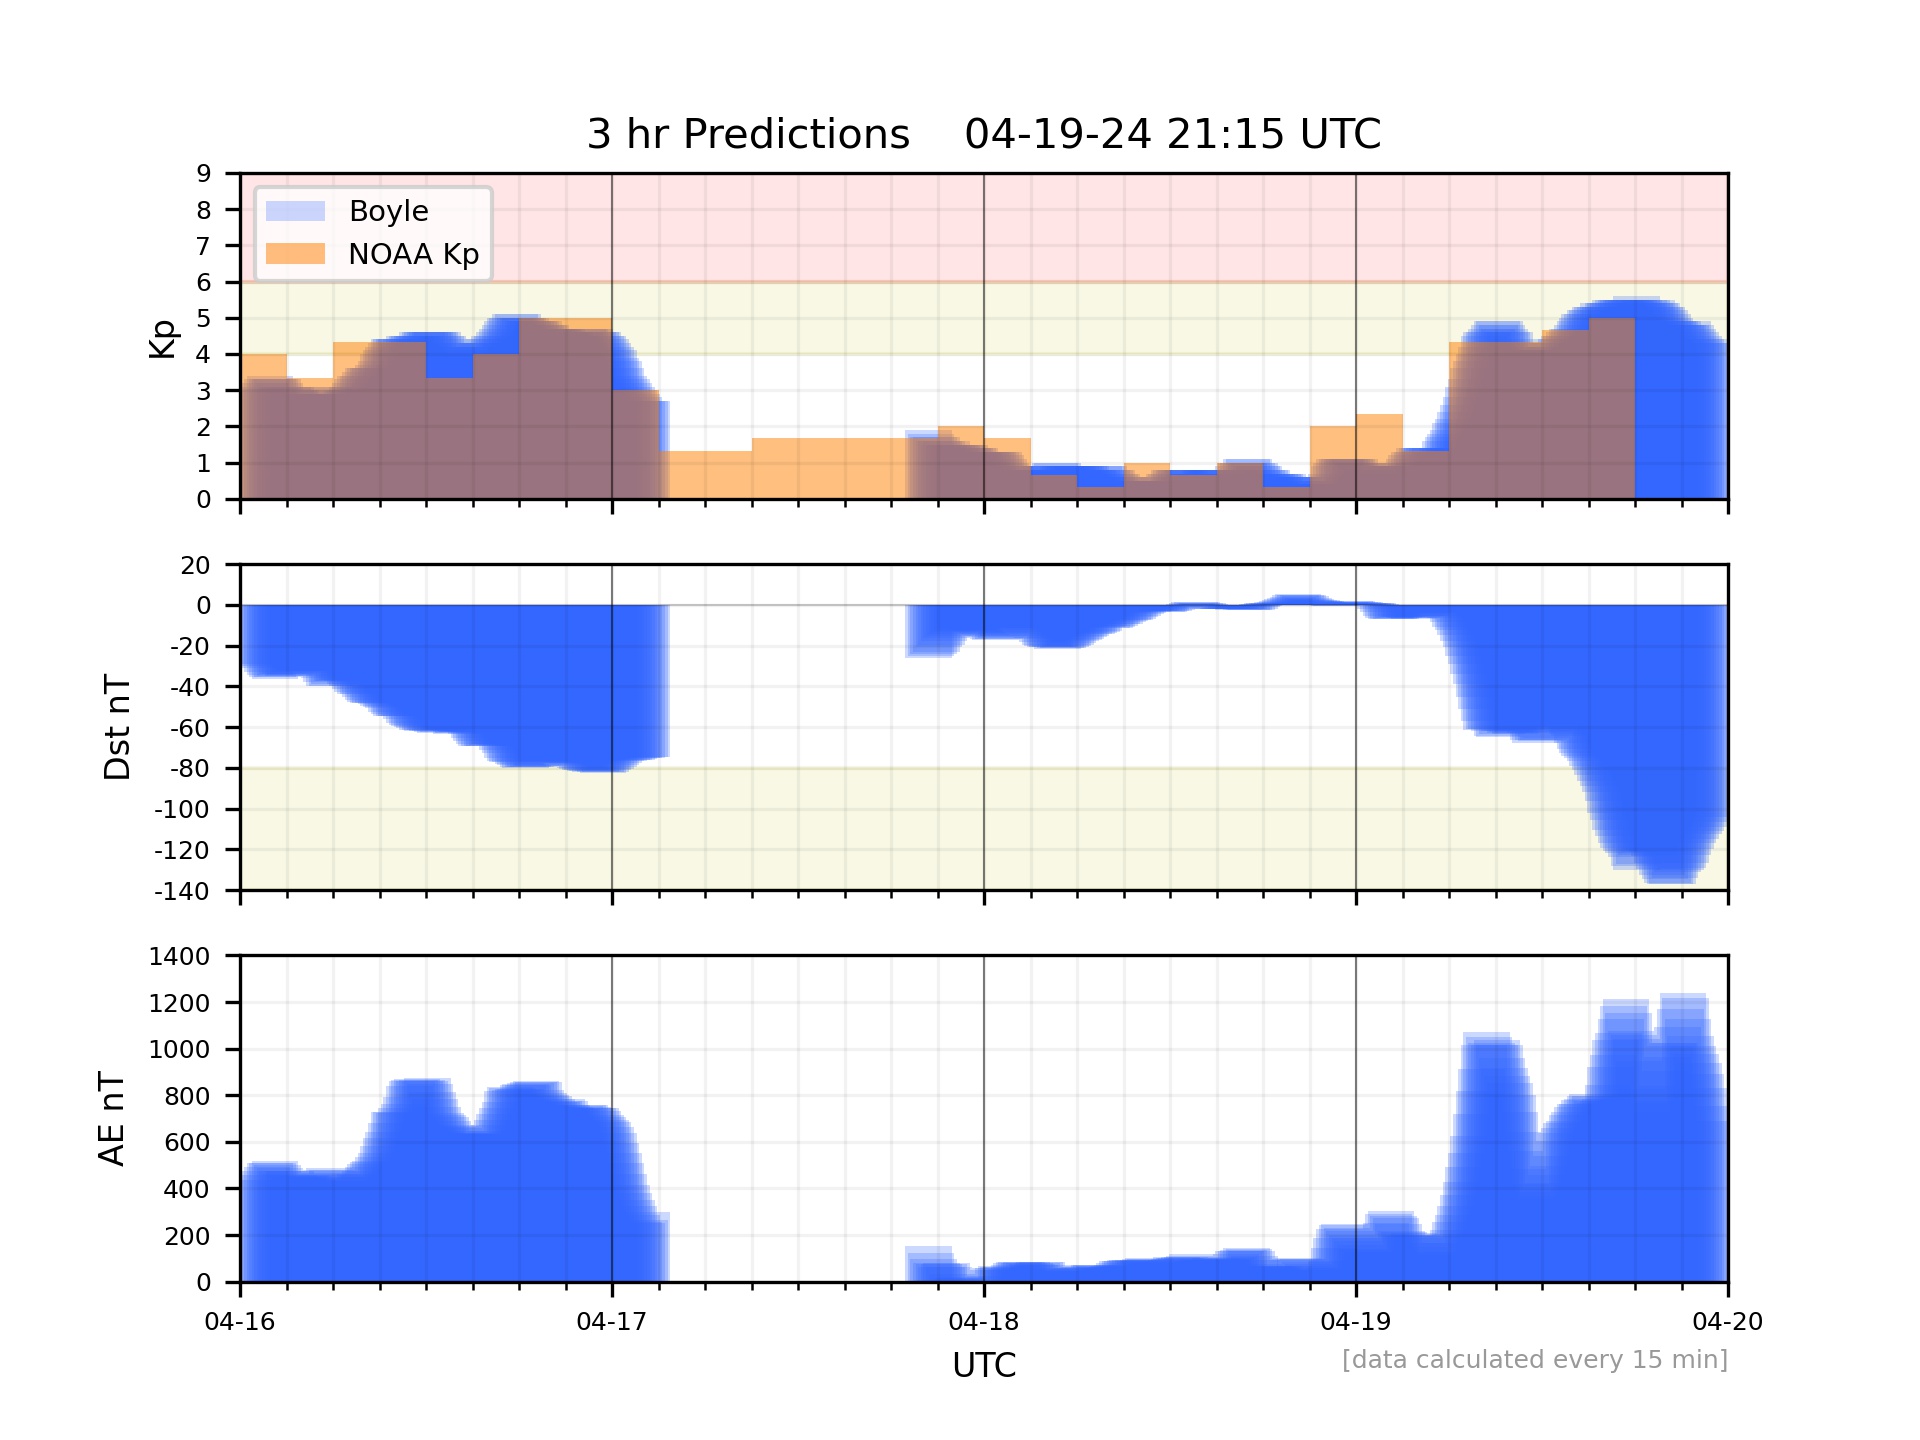
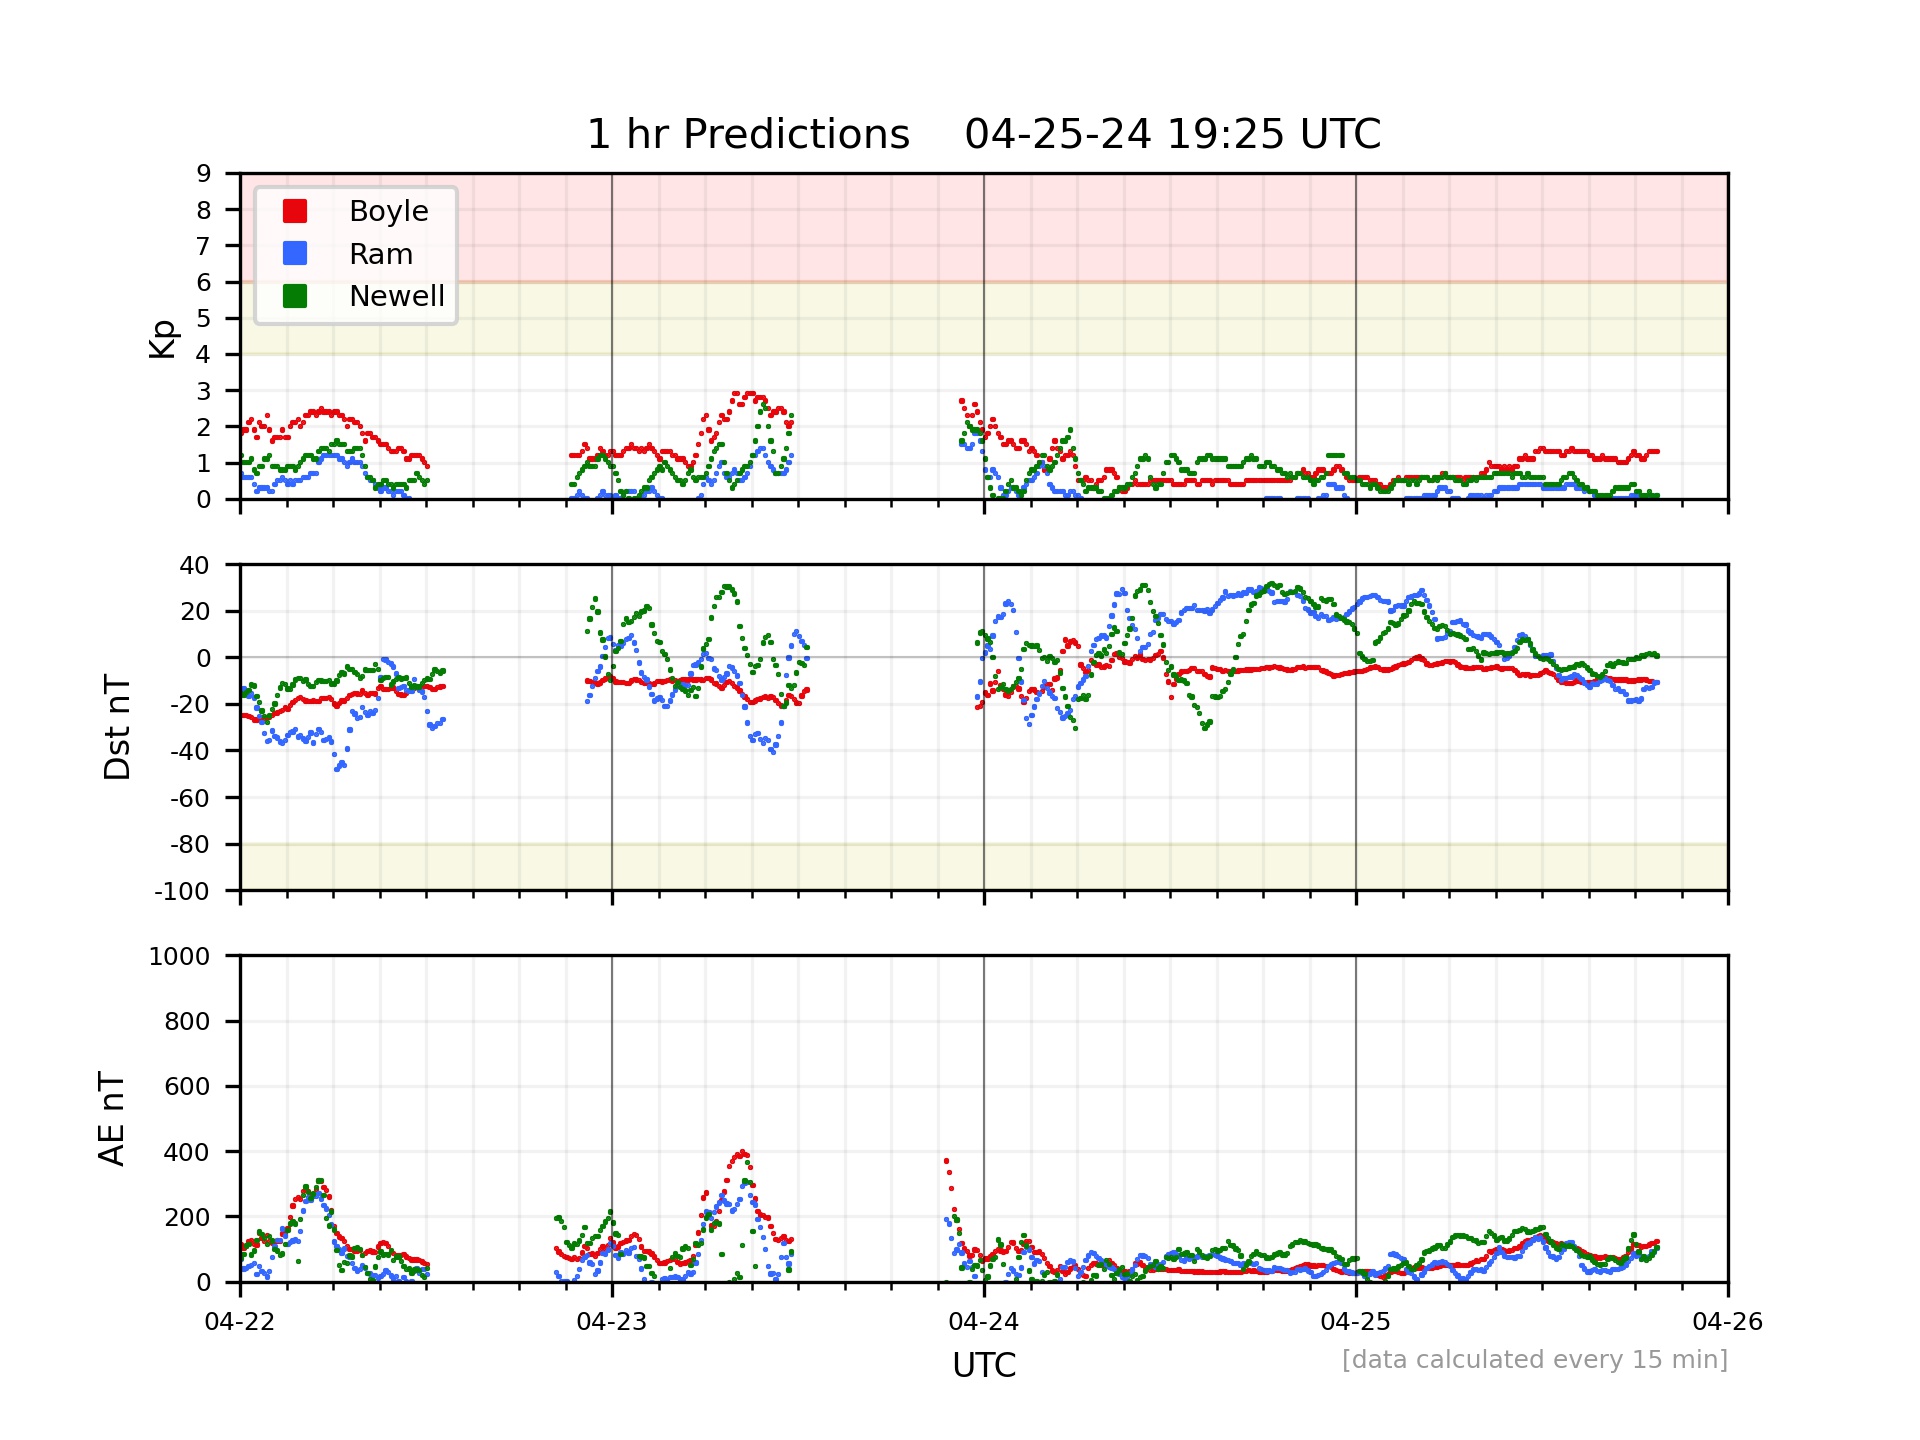
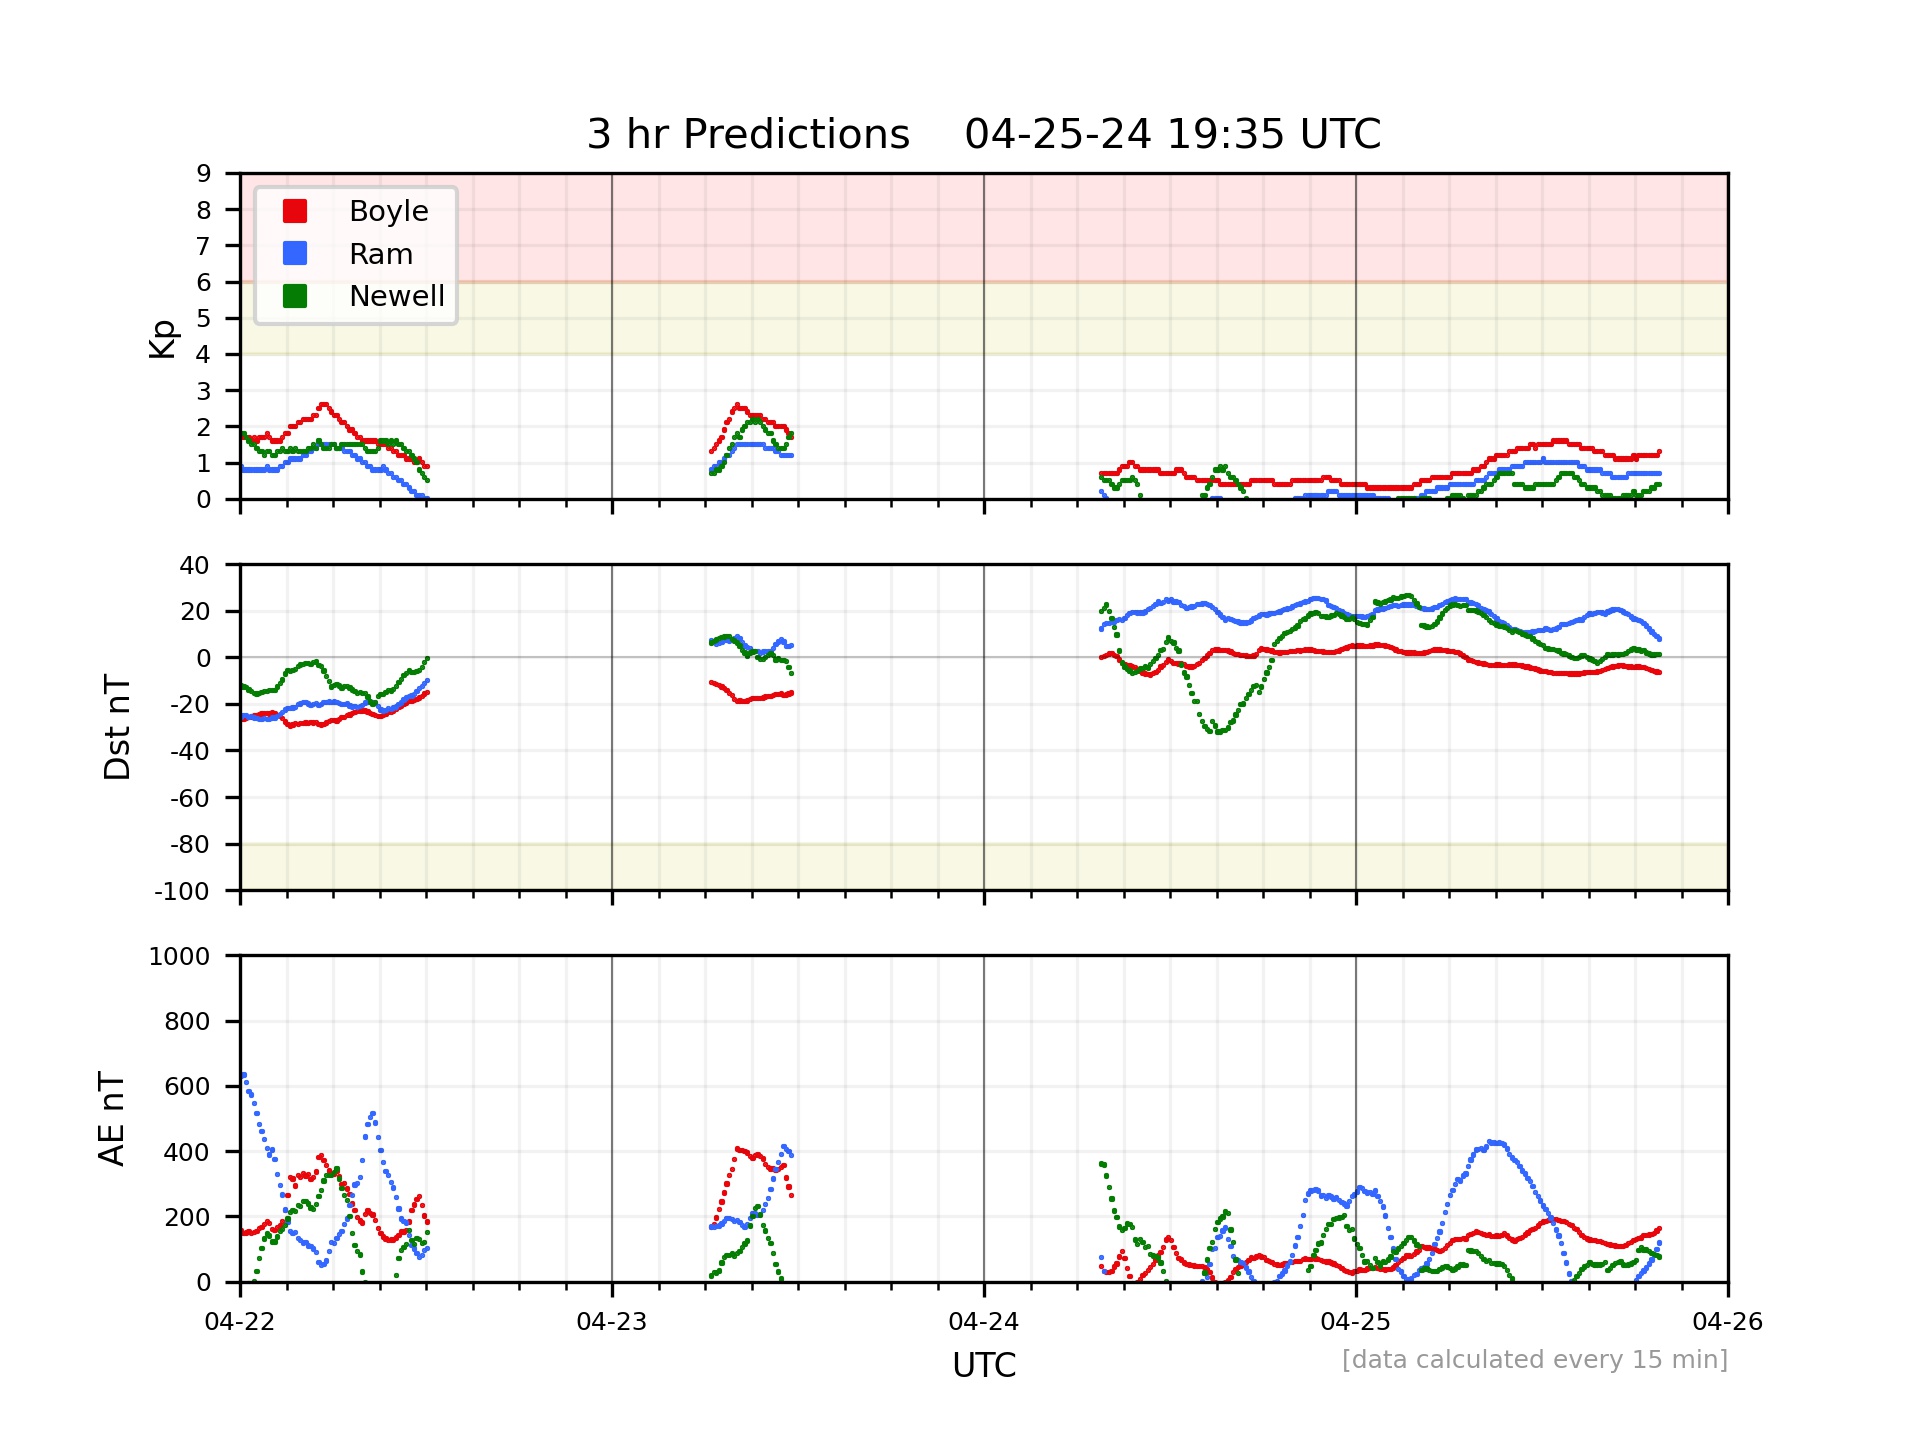
Predicted indices shown below are derived solely based on the solar wind data using models developed through Artificial Neural Networks using the Boyle Index as a base function. Kp=0 means a very quiet period while Kp=9 means extremely severe activity. The graphs appear "fuzzy" because each time is a superposition of forecasts. Each 15 minutes, the one-hour forecast is generated, to cover that 15 minutes and the succeeding 45 minutes. So the 1-hour prediction is always at least 45 minutes, and sometimes over 3 hours, ahead of the latest realtime Kp estimate from NOAA. We make each 15-minute prediction somewhat transparent so that you can observe the intrinsic variability in the forecasts. In a similar way, the 3-hour forecasts are shown overlapping. Every 15 minutes we make a new 3-hour-average forecast that covers the previous 30 minutes and the upcoming 2.5 hours. Thus the 3-hour averages are always more smooth than the one-hour average predictions but extend farther into the future.
 |
 |
 |
 |
 |
Auroral Forecast: OVATION Prime Real-time
For real-time plots of auroral power created by NOAA go to: OVATION Aurora
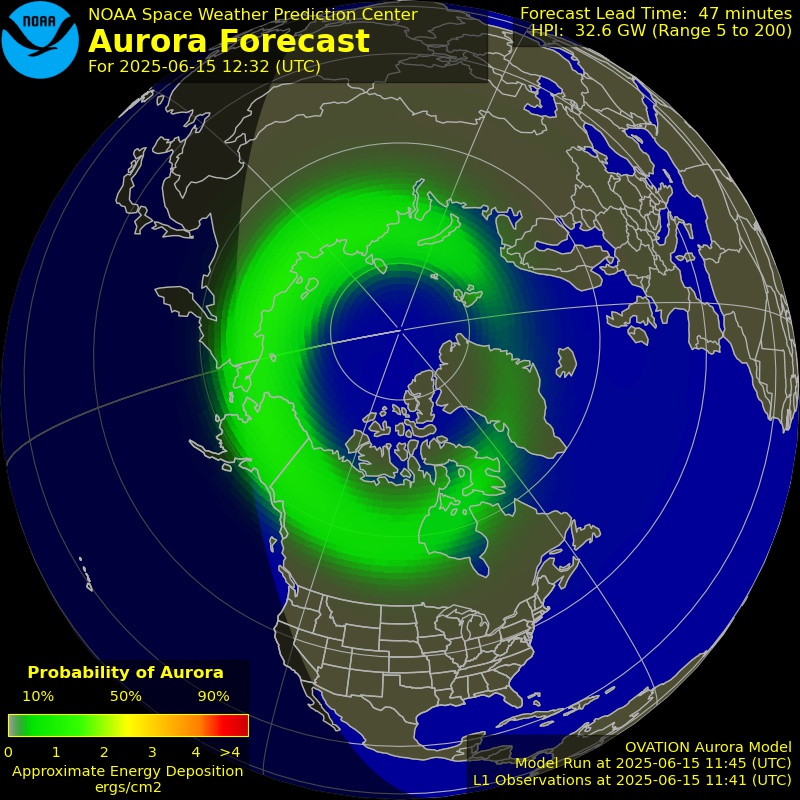
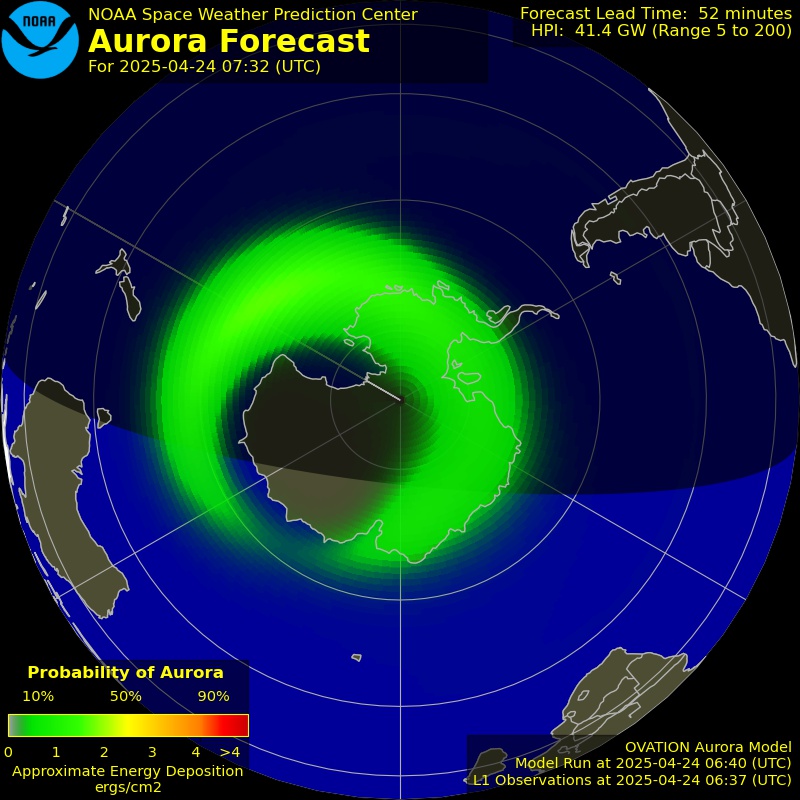
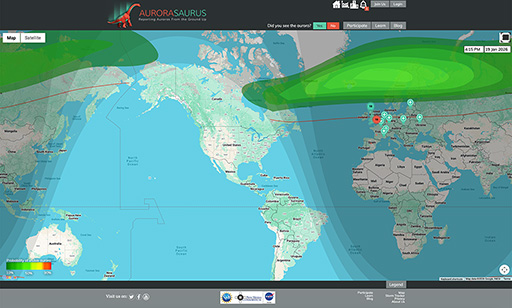
To see a real-time map of the aurora forecast and where observers are seeing it right now, go to: Aurorasaurus.org. And if you see the aurora, log your sighting and send in your pictures!
Data Source
The real time space weather data uses the last good received set of measurements from the Real Time Solar Wind site at the Space Weather Prediction Center. As of July 6, our data is from the NOAA "Solar 1" monitoring spacecraft.
Real-Time Solar Wind (RTSW) data refers to data from any spacecraft located upwind of Earth, typically orbiting the L1 Lagrange point, that is being tracked by the Real-Time Solar Wind Network of tracking stations. The NOAA Solar 1 satellite became the operational RTSW spacecraft in June 2026; however the other L1 spacecraft also continue to send down data at lesser priority.
Publications
- Boyle et al. Index Paper, 1997
- Bala et al. prediction paper, 2009
- Bala et al. improvements in forecasting, 2010
- Bala et al. validation of the model and test against Wing model, 2014
- Reiff et al. successful prediction of Gannon Storm, 2025
Current Forecast Data
- Estimated Boyle Index and Pressure [5 days]
- Rice Kp 1-hour predictions [5 days]
- Rice Kp 3-hour predictions [5 days]
- Rice DST 1-hour predictions [5 days]
- Rice DST 3-hour predictions [5 days]
- Rice AE 1-hour predictions [5 days]
- Rice AE 3-hour predictions [5 days]
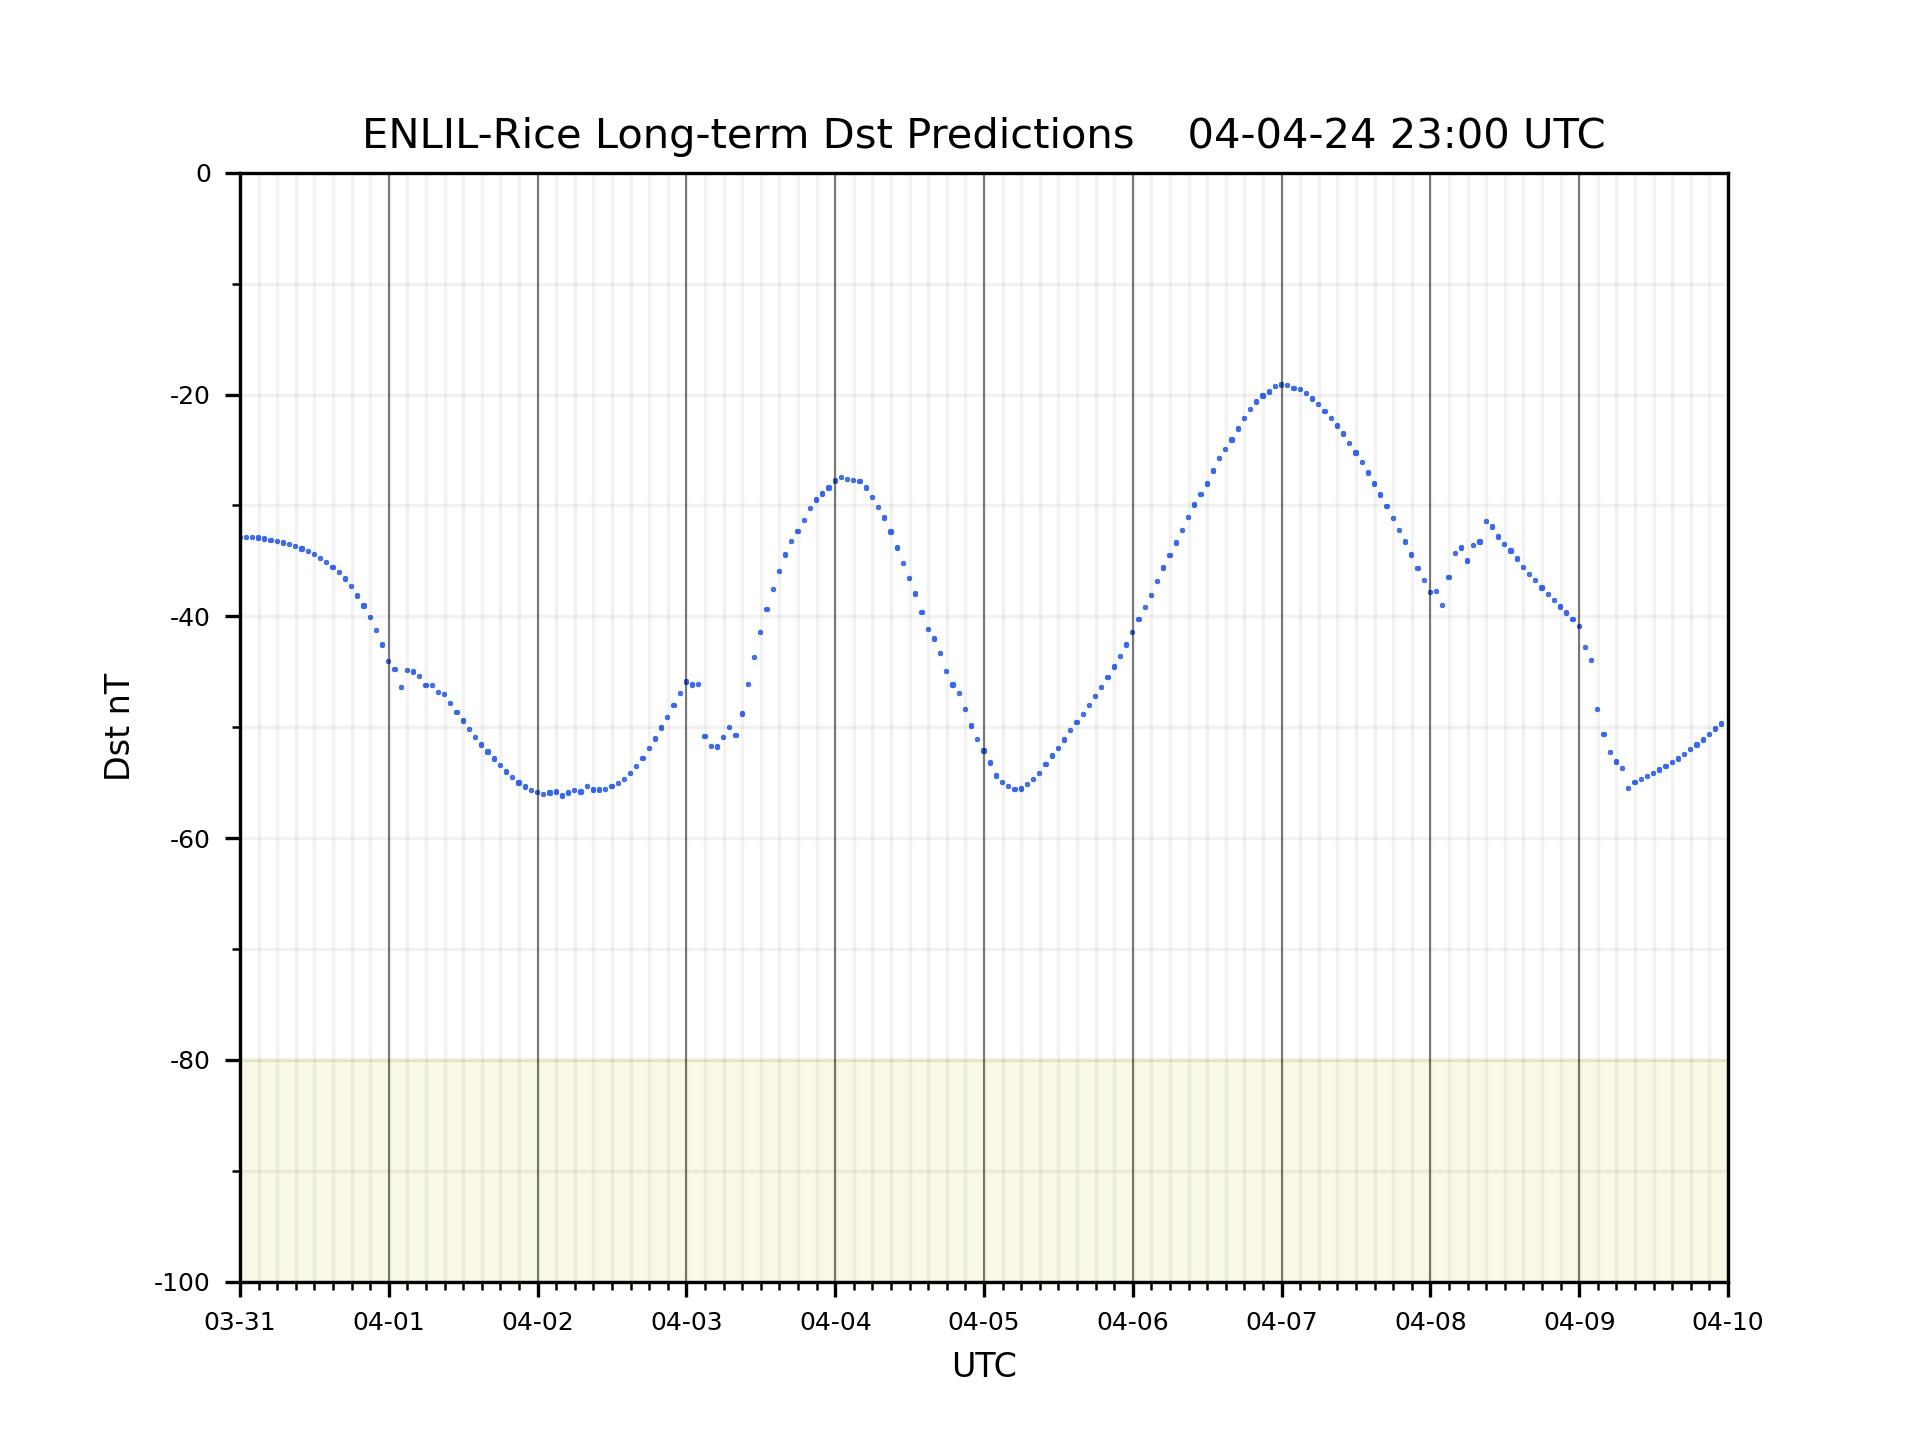
- Rice Enlil Kp Dst Predictions [10 days]
Archived Forecast Data
- Boyle Index and Pressure [08.13.13 -> TODAY]
- Rice Kp 1-hour predictions [01.05.15 -> TODAY]
- Rice Kp 3-hour predictions [01.05.15 -> TODAY]
- Rice DST 1-hour predictions [09.27.13 -> TODAY]
- Rice DST 3-hour predictions [09.27.13 -> TODAY]
- Rice AE 1-hour predictions [01.05.15 -> TODAY]
- Rice AE 3-hour predictions [01.05.15 -> TODAY]
Graphs of other solar wind parameters over the last 24 hours can be viewed at the NOAA site.
Realtime Dst, AE Estimates:
Other links of interest:

